

About the Author
Philip Pilkington is a macroeconomist and financial analyst who has written for a variety
of publications including The Telegraph, The Spectator, UnHerd, American Affairs, and
First Things. He is also co-host of the popular “Multipolarity” podcast and author of The
Reformation in Economics.
Introduction
“Strong, stable families” are considered a noble pursuit in some quarters, and an
outmoded distraction in others. Few have taken the time to look at the material or
practical benefits.
Economists have often recoiled at the idea of shoe-horning family ideals into their work,
disrupting the technocratic status quo of our treasuries. However, there is reason to
believe that even on purely economic terms, family policy may hold the keys to
unlocking the growth and dynamism which Western policymakers have been searching
for.
There are two parts to this paper. The first looks at long run economic growth theory
and the second at spiralling government budgets.
In both sections, our argument is clear: if we want prosperity, we could start by
rebuilding the family.
Part 1—Restoring the Family is a Hidden Key to Unlocking Long-Run Economic
Growth
The paper begins by arguing that restoring the family is a hidden key to unlocking long
run economic growth.
Models for measuring long-run economic growth have long neglected the importance
of growth in the employed population contributing to the maximum of their abilities.
A fixation on productivity has led to the neglect of the importance of two significant
factors by economists in their analysis of the economic health of our nations: labour
force participation and demographic trends.
Original modelling conducted for this report is striking—it finds that:
1. When one breaks down the divergence in economic growth trajectories
between the United Kingdom and the United States, the disparity between the two nations is not so much a function of productivity growth as it is differing demographic and labour force participation trajectories. Until very recently, both nations have held a steady productivity growth at around 2%, but the United Kingdom’s population and employment growth curve has been
considerably weaker. It might surprise the reader, but Britain has averaged
1.5% lower growth than the United States because of demographic and labour
force trends, not a productivity growth gap. This alone should be sufficient to
demonstrate that economists must take the family seriously.
2. When one plays the trends forwards, it looks likely that this situation will
worsen in both contexts. Demographic and labour participation trends are
going backwards. If things continue on their current trajectory, we will see both
the United Kingdom and the United States experience long-run economic
contraction due to their population and labour force participation trends. Here
Japan provides a cautionary case study.
We identify that the factors which are influencing these trends—be they low fertility
rates, mental health issues, drug abuse, or criminality—are all deeply tied to family
breakdown. The conclusion drawn is simple: restoring stable family formation is a
hidden key to unlocking long-run economic growth.
Part 2 – Family Breakdown is Driving Spiralling Government Budgets
The creation of the Department of Government Efficiency (“DOGE”) in the United States
under the leadership of Elon Musk and Vivek Ramaswamy points to a wave of frustration
at the bloated Western state, where few have presented meaningful answers to the
reality of growing annual deficits and burgeoning debt.
Across the developed world, public debt is at its highest levels ever, and has increased every year for the past decade. The debt to GDP ratio for countries within the
Organisation for Economic Co-operation and Development (OECD) in 2022 was over
100%.1 Everywhere debt is rising. The cost of servicing the deficit grows year on year.
Cheap money and the spiralling costs of the modern state have created incentives for
states to spend big with little regard for the next generation who will foot the bill. Few have been willing to challenge the consensus, or to scrutinise the root causes of this
very modern phenomenon.
As the West grapples with multiple social and economic challenges, policymakers have
been left struggling for solutions. The public conversation focuses on cost of living,
increases in taxation, COVID-19 and bureaucratic waste. But there is one driving factor
which is routinely neglected: the family.
Although we can be optimistic that the best practice of some of the world’s top tech
entrepreneurs will serve the United States well, the elephant in the room in the
discussion about government efficiency is spiralling social pathologies, which find their
root in family breakdown.
Here, our modelling is again striking. The paper provides an overview of a range of
different costs to the state, from social care to mental health, to crime—the family
touches every area of policy:
1. Across the West, health and social care spending is spiralling. A large
contributing factor is the increasing spending on institutional care, for both the elderly and children. In Australia, the Government spent $7 billion more on
social care for the elderly in 2022-2023 than it did in 2018-2019.2 Meanwhile,
the total number of children in the state care system in the United Kingdom
has grown by 28% since 2011.3 The year-on-year uptick in social care spending is one common thread across Western nations. Our nations must choose whether the state or the family will bear the burgeoning care costs. Without the family, there are serious questions about long run sustainability of national budgets.
2. Data on welfare spending (excluding family transfer payments) in the United
Kingdom indicates that if single parents were instead married, this would lead
to a reduction in welfare spending of around 19.3%, translating to savings of
0.9% of GDP, or £23 billion, annually. In other words, half the United Kingdom’s
defence budget. In the last five years in the United Kingdom, welfare claims for
those “not searching for work” rose by 550%—a 3.3 times larger increase than
claimants “searching for work”—reflecting a remarkable rise in labour
nonparticipation. Playing this scenario forwards, the data becomes increasingly
stark: the British welfare budget under Universal Credit is set to grow by 80%
between now and 2030.4 In view of this, the savings that are to be made if the
family unit were recovered could be considerable.
3. Crime also costs the taxpayer money. A recent study shows that 24% of adult prisoners have been in care in the United Kingdom, while only around 0.6% of
children will have been in care.5 Stabilising family formation will have a
profound impact on crime rates, with positive knock-on consequences for the
sustainability of government budgets and public safety expenditure.
In Summary
It is often said that prevention is better than the cure. But where the government can
provide the sticking plaster, a strong social fabric creates long-term resilience. While the government will only step in at the point of crisis, your family and friends are the people who step in the moment that you are not flourishing. We have grown accustomed to passing responsibility to the government. But this is not sustainable.
As public services face increasing strain and public debt becomes an historically
unthinkable burden, the centre is growing ever weaker and will not be able to hold, unless we value and restore the importance of the family. There must be a better story. The state has not been the central care provider throughout our history, nor can the
impersonal state substitute for the care of a loved one.
But there is a better way forward. An analysis of European fertility has revealed that marital fertility rates are at least 2.6 children per woman, and up to 6 times higher than
non-marital fertility rates—a stark reminder that the family is the key to population growth.
The wealth of a nation is in the health of its families and communities. Restore the family and you restore prosperity. Restore connection and you defeat loneliness and the
mental health epidemic. Our national deficits are a symptom of social malaise. But we can turn the ship around.
But for this to work, one thing is necessary—a simple word: responsibility. Each must play their part with the people around them—their families and communities. Yes, we need the right government incentives, but each of us must be willing to make the sacrifices necessary. For the sake of our economies and societies, the time has come to
restore the family.
Part 1: Restoring The Family: A Hidden Key to Long-Term
Economic Growth
It may seem counter-intuitive, but restoring the health of the family may be one of the most important steps we can take to ensure long-run economic growth.
The family directly influences population growth, mental health, crime rates, substance
abuse, suicide rates, the provision of care, educational outcomes, and even the sense
that each of us have that life has meaning and purpose. From the father holding his
wife’s hand during labour, to the offspring carrying the load of the coffin, it shapes our experience of life from womb to the grave. There is a deep and well-resourced bank of literature that supports each of these points. 6,7,8,9
When put like this, it should come as no surprise that the collapse of the family is starting to have economic ripples and has a profound bearing on the health of the public purse. But too often we have failed to properly address and enquire into the nature of the impacts. While studies exist that consider the different elements of this paper in isolation, the time has come for more comprehensive surveys of the long run implications of continuing to neglect the family for our economy and the health of the public purse.
This paper is split in two. First, we will look at the role that restoring the family may have to play in reigniting economic growth. We will then turn to the relationship between
spiralling public spending and family breakdown. In both areas, restoring the family may be the closest thing we have to a silver bullet.
Long-Run Economic Growth Theory: A Primer
Making a comprehensive economic case for family policy requires us to engage with the
contemporary economic framework when it comes to long-term economic growth.
Although most people are unaware of it, most economic policy set by both civil servants
when it comes to national budgeting, and by politicians when it comes to spending priorities, is done with reference to what is called in economics “long-run growth theory”.
Typically, non-economists will come face to face with the implicit language of long-run growth theory when they hear politicians push forward policies that are focused on increasing economic efficiency—so-called supply-side reforms—or when commentators bemoan the lack of productivity growth in developed economies and the need to increase this. A deep dive into long-run growth theory is not required, but an
understanding of the basic terms of the debate is crucial if we are to propose a new
framework that is focused on family policy and population growth.
When thinking about economic growth in the long-term, economists typically revert to
the Solow-Swan growth model—introduced independently by two macroeconomics,
Robert Solow and Trevor Swan, in 1956. The model sought to show what determined
the long-term rate of economic growth. Before the model was introduced, early
macroeconomists focused heavily on the role of the rate of saving in an economy. It was
generally thought that a higher rate of saving meant a higher rate of investment, and since higher investment led to a higher stock of capital goods, this would mean that the economy would grow faster.
The Solow-Swan model showed that, under certain standard assumptions in economics, this was not the case. Rather, the Solow-Swan model found that only two variables really
mattered to long-term economic growth: population growth and productivity growth.
The Solow Swan Model
Long Run Economic Growth = Population Growth + Productivity Growth
Refined Solow Swan Model
Long Run Economic Growth = Employed Population Growth + Productivity Growth
The Solow-Swan model is dominant in long-run economic growth theory, but for our purposes we can refine it a little. While it is broadly true that long-term economic growth stems from population growth and productivity growth, we can improve this assertion slightly by stating that what matters is not population growth per se, but rather
the growth in employment. Employment, in turn, is determined by three variables:
working age population growth, labour force participation growth, and the growth in
unemployment.
There is More to Growth than Productivity
Since the publication of the Solow-Swan model, economists have focused mainly on
productivity growth as being key to the long-run growth of an economy. This focus by economists has led to policymakers also focusing almost exclusively on productivity growth. Whenever we hear politicians talk about “regulations” or “supply-side reforms”, they are implicitly—whether they know it or not—referring to the focus on productivity
growth that has emerged from the Solow-Swan growth model.
The issue with productivity growth is that it is a somewhat mystical variable. It is derived by taking GDP and dividing it by the size of the labour force. Phrased differently, productivity growth is whatever growth occurs in the economy that is not the result of an increase in the labour force. While economists will interpret this to mean an increase in the productivity driven by better technology allowing each worker to produce more, it is not clear that this is the case. Because productivity growth is not measured directly,
we are not actually sure what it is—something that seems lost on policymakers who insist on gearing policy to try to increase productivity growth.
By contrast, the second Solow-Swan variable—employed population growth—has generally been neglected by economists, even though it is much clearer what is being measured when we talk about population. Economists tend to take this as a given, without considering the reality that demographic trends and labour force participation
trends vary starkly country by country.
Restoring the Family: Key for Demography
Before building out a model for how one can measure the bearing that robust family
policy could have for economic growth, it is worth pausing to consider how the health of the family unit plays into the two of the key variables that we are considering in this
chapter: demographic trends and labour force participation.
Employed Population Growth = Working Age Population Growth + Labour Force
Participation – Unemployment
As described above, the three key variables in “Employed Population Growth” are the
growth in the working age population, as well as the levels of labour force participation and unemployment. In all three areas, the evidence is clear that the family is integral.
First, it is evident and uncontroversial to state that the family plays an important role in
population growth and demographic trends. Fertility rates are collapsing across the Western world, and it is becoming increasingly clear that something is going to need to be done to counteract this trend. Until recently, it was viable to maintain that fertility rates would remain slightly below replacement rate, and the difference could be made
up by sustainable rates of inward migration. But as fertility trends get worse by the year, and forward-looking metrics paint a dismal picture of the future, it is becoming
increasingly hard to ignore a demographic crisis looming just over the horizon.
Renewing the family unit is critical if we are to turn this around. An analysis of French, as well as wider European fertility data, uncovered an extraordinary disparity in fertility
outcomes between married and non-married couples. The study highlighted that even though non-marital childbearing has become widespread and socially accepted, marriage remains the “decisive factor [in] shaping fertility”. Calculating birth rates by a
given age and marital status, and aggregating across all ages, there were stark
differences found between marital to non-marital fertility—France was discovered to have the lowest, but still significant ratio of 2.6 to 1, and Italy the highest with a ratio of
almost 6 to 1. Similar findings can be observed across “every country in Europe”.10
Restoring the Family and Labour Force Participation
Second, restoring the family will be necessary if we are to reverse the disturbing trend
of declining labour force participation.
When we look at labour force participation rates for men, we see them falling across the world. This trend is shown in the chart below and has recently become a major issue explored by economists.11
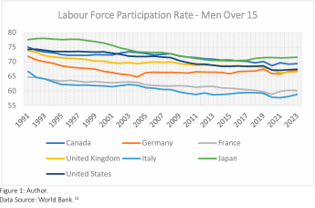
Why is this issue important for family policy? Studies strongly suggest that the declining male labour force participation rate might be tied to family dynamics. Studies show that
the core reason why men might be dropping out of the labour force is due to challenges in early life leading to poor health and behavioural outcomes in adulthood.13 It is popular amongst some free-market conservatives to attribute welfare dependence to
the existence of the welfare system alone. But this assumption abstracts too much from the underlying sociological causes of why young boys act out, and fall into criminality, drug abuse, and poor health. Ignoring these variables leaves policy reformers who want
to increase labour force participation spinning their wheels, constantly focusing on cutting government programs which have no material effect on labour market participation rates. Advocates of family policy, on the other hand, are well-placed to address these issues and take seriously the impact of declining labour force participation
by men in developed economies.
Consider mental health—there is strong evidence that family breakdown has had a
profound bearing on the mental health of our nations. There is a significant bank of data
showing the ties between mental and physical health and the health of the family
life,14,15,16 and inversely family breakdown is closely tied to rising mental health troubles. Family relationships provide resources that can help an individual cope with stress, engage in healthier behaviours, and enhance self-esteem, leading to higher well-being.
These relationships become more important for well-being as individuals age and social networks diminish,17 and being married—especially happily married—is associated with
better mental and physical health.18,19,20 Sigmund Freud and his followers, while focused on individual psychology, were convinced that the largest impact on an individual’s emotional and mental well-being was the relationships they formed with their families.21 Another study using regression analysis found that “there are substantial and significant differences in the prevalence of mental disorders among children who live in different family types” and that “children in original [or ‘traditional’] families are about
half as likely as children in step, blended, or one-parent families to experience any
mental disorder.”22
Recent studies show that the impact of poor mental health on labour force participation is “substantial, with a one standard deviation decrease in mental health reducing the
probability of participation by around 17 percentage points”.23
And the data suggests a surge in mental health issues in the past 20 years. The number of patients diagnosed with a major depressive disorder in the United States, for
example, has risen from around 11.9 million in 1996, to around 25.4 million in 2015.24 In the United Kingdom, studies show large differentials in employment rates between
those with good and those with poor mental health. One study shows that among British workers aged 21-55, the employment rate amongst those with good mental health is 87%, whereas it is only 70% for those with poor mental health.25
Another relevant case study is drug use. Drug abuse is known to be associated with
unstable family structures. Once again, this trend is most obvious amongst children. One study finds that “children from single-parent families were at significantly greater risk of
drug involvement than children of dual-parent families, and this generalisation held
across multiple substances.”26 Childhood drug abuse often translates into adult drug abuse. One study went so far as to control for genetics by taking identical adult twins
who grew up in different familial environments. It found that “exposure to parental divorce and relationship discord appears to be important for understanding the
transmission of alcohol use disorder.”27
Studies show that recreational drug use does not significantly impact labour force participation. But chronic drug use has major effects, especially for men.28 Data strongly
suggests that chronic substance use is on the rise, especially in the United States. Drug overdose deaths have risen from 6.8 per 100,000 people in 2001, to 32.4 in 2021—a
staggering increase of 376%.29 Alcohol-induced deaths rose from 7 per 100,000 in 2000, to 13.1 in 2020—an increase of 87%.30 The rise in chronic substance may explain why
since 2000 the male labour force participation rate has fallen by 9.3%, while the female labour force participation rate has fallen only 4.7%.
In their landmark study Deaths of Despair and the Future of Capitalism, Anne Case and Angus Deaton elaborate on this intersection between family breakdown, drug abuse,
and declining labour force participation—all of which contribute to what they describe as an epidemic of “deaths of despair”. Here, divorce—particularly among middle aged men—is isolated as a particularly salient factor in the trends towards deaths of despair and declining labour force participation in the United States.31 This phenomenon can be observed in the United Kingdom too. A recent study by the British government showed that the generation currently in its middle age—known as “Generation X”—is the most likely to die from suicide and drug overdose. What is more, the age at which people die of drug overdose has increased over time—meaning the deaths are tracking with Generation X as they age.32 Now consider the following chart of divorce rates in the United Kingdom. As we can see, it was Generation X that was disproportionately impacted by the sharp increase in divorce. This generation experienced the emotionally tumultuous transition from a society in which divorce was rare to one in which divorce was relatively common.
In recent years, divorce rates have actually been coming down, but this change may not be so positive as it first appears. The number of people getting married (and having families) in the first place has drastically declined in this period, and therefore it is probable that those who are still getting married are less likely to get divorced, as there is a high chance they will be more selective, or less inclined to take a liberal attitude towards divorce. Hence, in reality, what this trend most likely shows is a decline in marriage, rather than divorce. Taking all of these factors into account, there are good reasons to think that Generation X’s status as the “misery generation” has a lot to do with divorce trends in the 1960s and 1970s in Britain, as the correlation with increased drug abuse would suggest.
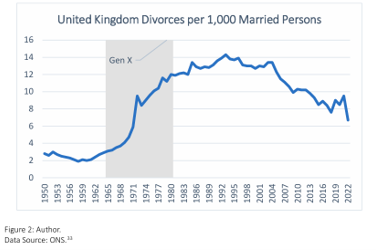
The health of the family is connected to deaths of despair, substance abuse, mental health figures, and crime. The connections between family breakdown and labour force participation are therefore clear, and must be taken seriously.
The Family is at the Centre of Employment Growth: The United Kingdom as a
Case Study
It should be starting to become clear why family policy has potentially a profound bearing on economic growth.
Economists and policymakers have, for generations, fixated on productivity growth as the most important variable relevant to the long-run health of our economies. While doubtless productivity is important, we have so far sought to establish that the other variable in the Solow-Swan framework—the rate of growth of the employed population—is given equal weighting, and thereby prioritised by policymakers. Strong families are at the core of a stable fertility rate and a buttress for healthy labour force participation—and therefore evidently significant.
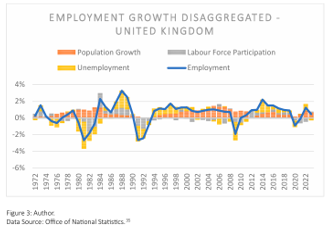
To build on this idea, it is worth considering some case studies in more detail, looking at the dynamics in the United Kingdom in the chart below.34 Here we see quite different dynamics in the variables. Unemployment and labour force participation growth tend to fluctuate, while overall working age population growth has provided a stable ballast for British employment growth over the past 50 years.
We can get further insight into British economic growth by looking at changes in employment by place of birth. This gives us a sense of how much growth is being driven by domestic birth rates, and how much is being driven by immigration. The following chart shows this data broken down. Here we see some very interesting dynamics. In the late-1990s—when data first becomes available for this series—we see that most of the employment growth was from domestic births. We can infer from net migration numbers that this was the case stretching far back in time. Yet since the late-1990s, the importance of domestic birth rates in supporting employment growth—and hence economic growth—has waned. This trend has become particularly pronounced over the past two years, as domestic births do not seem to be contributing to economic growth at all.
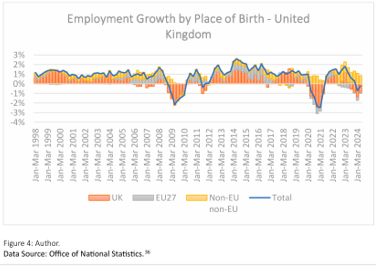
Some might argue that this chart simply provides that Britain requires ever-growing rates of migration. It is true that Britain’s economy is currently heavily reliant on immigration for its economic growth and that this has become particularly apparent in the last few years. But it seems unlikely that Britain can continue to import large numbers of people indefinitely to keep its economy growing. In a previous study, we showed that if Britain continues to pursue this strategy the share of first-generation immigrants in the overall population will rise from just over 15%, today to between 37% and 54% by 2080.37 We do not believe that this will prove sustainable, socially or politically. The other problem is that there may not be enough immigrants available. Birth rates are collapsing across the world, and developing countries are catching up with developed countries in terms of per capita GDP, thereby providing fewer incentives for people to leave their places of birth. The above chart should be seen as a warning to us that if we do not raise birth rates soon, the prospects for economic growth will soon
collapse.
The conclusion that this leads us to is the simple idea that the domestic total fertility rate, as well as long run health of the economies. In both cases, all roads lead us to the importance of the family. general labour force participation, must be increased for the sake of the long run health of the economies. In both cases, all roads lead us to the importance of the family.
A Post-Solow Framework for Long-term Growth
Now that we understand the factors contributing to employment growth, we can turn to an overall framework that we can use to discuss economic growth. Here we will compare the situation in the United States historically with the situation in Britain.
The following two tables break down real GDP growth in the United States by decade into the employment component and the productivity component.38,39 What we see here is that population growth has, since 1960, been a larger driver of GDP growth in the United States than productivity growth. Over the whole period from 1960 to 2022, population growth has contributed 2.11% to GDP growth, while productivity hascontributed only 1.55%. Britain has had much less success with population growth since the data started. Since the 1970s, population growth in Britain has contributed only
0.62% to GDP growth, while productivity growth has contributed 1.51%. This means that British productivity growth has been roughly the same as American productivity growth, and almost all of Britain’s postwar economic underperformance can be attributed to its inferior demographic picture.
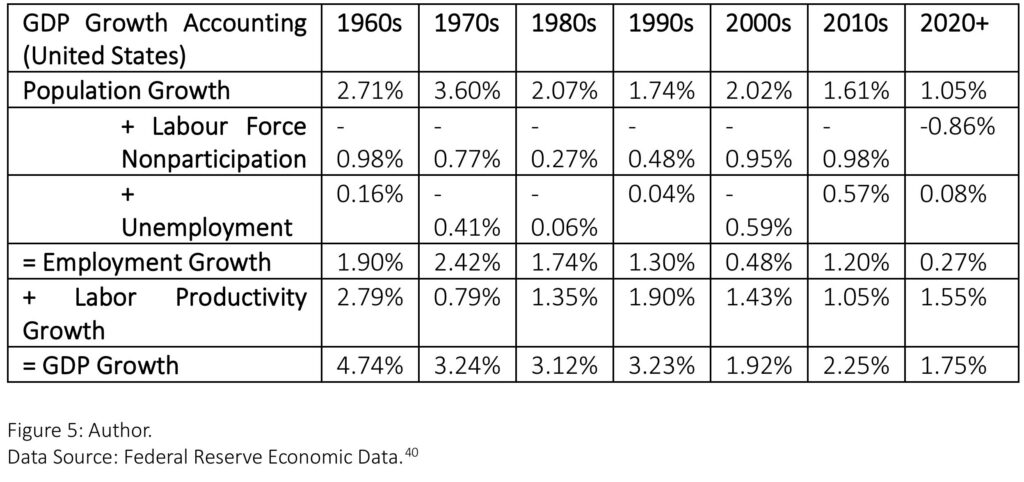
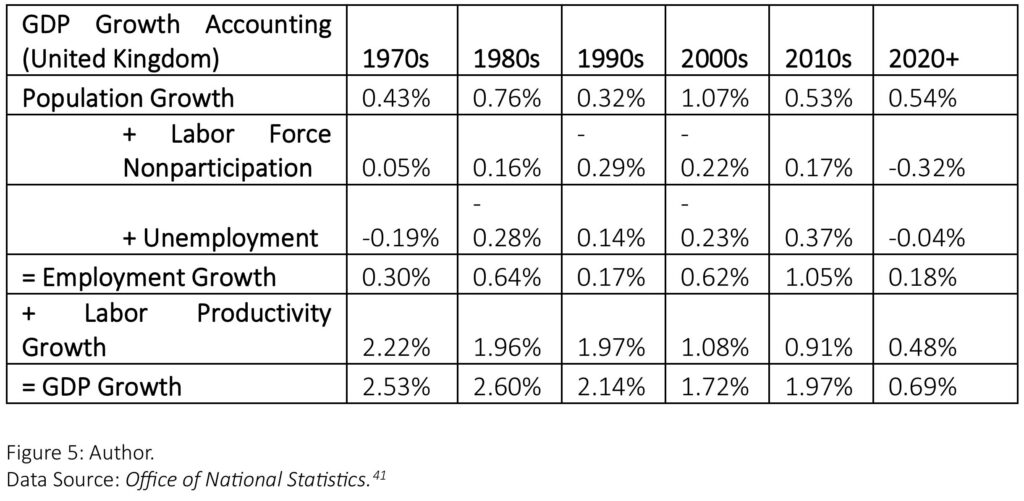
The profiles of the two countries when it comes to unemployment and labour market non-participation are also very different. The United States has seen a lot of people drop out of the labour market and a much less severe long-term unemployment problem,
while the United Kingdom has seen relatively little growth in labour market non participation and very severe issues with long-term unemployment. This discrepancy seems likely explained by differences in culture and differences in the respective welfare
systems. All in all, both countries have problems with people not working, which should be kept firmly in mind when we consider the non-fertility effects of family policy.
Of course, the looming demographic crisis raises the obvious question: moving forward, will population growth continue to add around 1.5% to GDP growth in the United States, and around 0.62% to GDP growth in the United Kingdom? The answer is straightforward:
no. We are already seeing, in the 2010s and early-2020s, the impact of slowing population on GDP growth in the United States—and this is with continued, very high inward migration numbers. If we take into consideration the falling labour force participation rate in the United States, the population component in GDP performs abysmally, adding only 0.63% to GDP in 2010s and 0.19% to GDP in the 2020s so far. This is far below the historic average of 1.4%. Meanwhile in Britain, migration is currently at record levels and is proving highly politically destabilising, yet the population component of GDP is lower than it was in the 1980s or the 2000s. Factoring in people dropping out of the labour force and unemployment, the employment component of GDP growth is one of the lowest on record. Coupled with very low labour productivity growth, this explains the economic stagnation that Britain has slipped into.
If the demographic crisis leads to negative population growth, then economic growth could start to contract. The stagnation that we see in the economy of Japan is indicative in this regard. Between 2002 and 2022, Japan saw average annual population growth of
around -0.8% and average annual real GDP growth of 0.6%. In the 20 years prior to that, it saw average annual population growth of around 0.4% and average annual real GDP growth of around 2.8%.42 Japan still appeared able to achieve productivity growth until recently,43 most likely reflecting the heavy manufacturing and export orientation of their economy. Since productivity is stagnating across the developed economies, any shrinkage of the population will mean a shrinking of the economy. This could have enormous ramifications for the sustainability of public debt in these countries, not to mention the tax base.
It is interesting that when discussions of population issues arise, those who are unconcerned about low birth rates typically claim that we are on the cusp of some sort of productivity miracle that will ensure economic growth with a shrinking population.44 Yet the productivity numbers themselves have been on a downward trend for decades and are now stagnant across much of the developed world. The reality is that no one really knows how to raise productivity growth, no matter how much economists posture to the contrary. There is every reason to think, however, that by gearing government policy to family formation, we should be able to raise the rate of population growth.
When we break it right down productivity growth is inherently a mystical variable; it is whatever is leftover in GDP growth that cannot be accounted for by labour force growth. Labour force growth, on the other hand, is well-understood and straightforward. Family
policy gives policymakers a compelling lever to pull on to try to target population growth and therefore increase the prospects for economic growth. This is not to say that increasing family formation and birth rates is an easy task. It is not. But in contrast to
trying to raise productivity growth, we at least fully understand the problems and what would be needed to solve them.
Part 2: Government Spending and Social Pathologies
Family policy has a part to play if we are to address one of the most pressing issues of our time: the tendency towards stagnation in economic growth. As discussed, the reason for this is not only the close connection between family formation and total fertility rate, but also because of the way that social pathologies thatarise as a result of family breakdown contribute to a dwindling labour force participation rate.
These same social pathologies are also critical if we are to address one of the other major challenges facing our nations: bureaucratic bloat. Every single one of the social pathologies described in the first part of this essay carry considerable costs to the state:
1. Rising mental health illness carries health and welfare costs;
2. Declining care provision from the family correlates to the increased burden on
social care;
3. Single-parent families are far more likely to claim benefits;
4. Rising substance abuse and crime are a consequence of family breakdown.
If government is expected to carry the nation’s care burden, without subsidiary responsibility being passed to families and local communities, it is inevitable that budgets start to bulge across the full range of departments.
Consider the United Kingdom. In 2024, health, welfare, and social care spending accounted for 50% of the Government’s budget. Similar costs are being born by nations across the OECD, many of which carry increasingly unsustainable levels of public debt.
When we play this trend forwards, accounting for existing deficits and current demographic trends, the consequences begin to seem dire pretty quickly.
In this section, we point to the connection between government spending and family formation in greater depth.
Health and Social Care Spending
The family plays a central role in providing for essential care needs in society. When the family is absent, the state must step in. Louise Perry et al. observed in an Alliance for Responsible Citizenship report last year:
“The need for care has always been with us and is still with us today. But as nations have modernised, the structures that once made up a ‘village’ of caregivers have dissolved. As birth rates decline, people have fewer relatives. Increased mobility as people move to study and work means that not only do people live further away from family members, but they also have less of a sense of rootedness where they live. Our neighbourhoods are no longer a permanent community, but rather a temporary stopping place. And in the fast-paced modern lifestyle, people have little time and flexibility to be part of these networks of care that are still so important. As the ‘village’ model of care provision has declined, the state has stepped in to perform some of these functions. The state now provides care functions ranging from daycare subsidies, to state schools (effectively providing free childcare for older children), to social care for the elderly.”45
When one breaks down the data of health and social care spending across the Western world, we see the depth of the economic cost of replacing familial care with state intervention.
Even since the end of the COVID-19 peak in healthcare costs, figures have remained consistently high across the board. In the United Kingdom, total healthcare expenditure reached £292 billion in 2023 (or 10.9% of GDP), of which £239 billion was directly government-financed.46 Adult social care added an extra £28.4 billion in this same year, 47 and local authorities in England spent a further £12.2 billion on social care services for children.48 In Germany—which spends the most on healthcare out of all European Union countries—total healthcare spending reached €497 billion in 2022, approximately €383 billion of which came from government-funded sources.49 And it is
not just the big-state, European nations which are seeing huge rises in costs: the United States spent a total of $4.5 trillion on healthcare in 2022—equating to 17.3% of GDP— with $944.3 billion and $805.7 billion coming directly from the government’s Medicare and Medicaid programmes respectively.50
What should we draw out from these astronomical numbers? And how do they relate to family breakdown? There are key indicators within this data which suggest that the breakdown of familial care for our young, elderly, and mentally vulnerable are driving
these rising costs for the state, at a rate which will soon become unsustainable.
Care for our elderly used to be viewed as a privilege, a form of reciprocating the care our parents had given us in our early years as they reach the end of their lives. However, over recent decades, elder care has become increasingly institutionalised, and reliant
on government funds rather than interpersonal relationships. As a result, demand for public expenditure to care for our elderly is skyrocketing, whilst simultaneously our populations are aging across the West. If we take the example of Australia, the
government spent approximately $28.3 billion (AUD) on aged care in the year care—almost double the amount spent on home care and support, where familial separation is limited.51 If we compare this trend to the United Kingdom, we see that the £28.4 billion spent on
adult social care in 2023 outlined above represents a £2.7 billion increase in real terms from expenditure in 2010-11.52 The vast majority of this sum is dedicated to caring for the elderly, as is shown by the Institute for Fiscal Studies’ estimate that public social care
spending on the average 60-year-old is around double the amount for the average 30 year-old, rising to triple for the average 75-year-old, 12 times as high for the average 80 year-old, and 24 times as high by the age of 90. And these increases are not simply due
to poorer health in old age, given that healthcare spending for the average 90-year-old is 8 times higher than for the average 30-year-old—only a third of the size of the social spending gap.53
And perhaps most significantly, the long-term trajectory of this spending arc is incredibly concerning. In the United Kingdom, social care spending grew by an average of 3% per year between 1997-98 and 2019-20—an already significant rate—but surged by an average of 7.8% per year under the second Blair term,54 notorious for its absorption of family ties and care provision into the state. If these rates of increase continue, government budgets will soon not be able to cope with the level of need amongst our elderly.
These figures paint a bleak picture for the future of caring for our elderly population, with the dependency ratio worsening year-on-year, and our social ties to our elders continuing to fray. It is clear that outsourcing their care to the state is becoming
unsustainable, and the level of care itself is falling short. The British government’s Health and Social Care Committee has estimated that by the close of the current financial year, a further £7 billion per year will be required to meet adult social care needs, with public
services calling for assistance to meet the overwhelming demand. Given that adult
social care has already become the second largest area of local government spending—second only to education—in the United Kingdom,55 there is only so much further these costs can grow.
Whilst there are many reasons deeply embedded in our culture for the transfer of the care of the elderly from family to state, it is worth noting the concurrent rise in social care costs for our children, and the likely relationship between the two. If children do not receive love and care from their parents, then the natural familial care cycle is broken, and they are less likely to wish to care for their parents once they reach old age.
The rise in social care spending for children across the West demonstrates an increase 2022-23, up from $21.93 billion (AUD) on aged care in the year 2022-23, up from $21.93 billion (AUD) in 2018-19. 58% of this total was spent on residential care—almost double the amount spent on home care and support, where familial separation is limited.51
If we compare this trend to the United Kingdom, we see that the £28.4 billion spent on adult social care in 2023 outlined above represents a £2.7 billion increase in real terms from expenditure in 2010-11.52 The vast majority of this sum is dedicated to caring for
the elderly, as is shown by the Institute for Fiscal Studies’ estimate that public social care spending on the average 60-year-old is around double the amount for the average 30year-old, rising to triple for the average 75-year-old, 12 times as high for the average 80year-old, and 24 times as high by the age of 90. And these increases are not simply due to poorer health in old age, given that healthcare spending for the average 90-year-old is 8 times higher than for the average 30-year-old—only a third of the size of the social spending gap.53
And perhaps most significantly, the long-term trajectory of this spending arc is incredibly concerning. In the United Kingdom, social care spending grew by an average of 3% per year between 1997-98 and 2019-20—an already significant rate—but surged by an average of 7.8% per year under the second Blair term,54 notorious for its absorption of family ties and care provision into the state. If these rates of increase continue, government budgets will soon not be able to cope with the level of need amongst our elderly.
These figures paint a bleak picture for the future of caring for our elderly population, with the dependency ratio worsening year-on-year, and our social ties to our elders continuing to fray. It is clear that outsourcing their care to the state is becoming unsustainable, and the level of care itself is falling short. The British government’s Health and Social Care Committee has estimated that by the close of the current financial year, a further £7 billion per year will be required to meet adult social care needs, with public services calling for assistance to meet the overwhelming demand. Given that adult social care has already become the second largest area of local government spending— second only to education—in the United Kingdom,55 there is only so much further these costs can grow.
Whilst there are many reasons deeply embedded in our culture for the transfer of the care of the elderly from family to state, it is worth noting the concurrent rise in social care costs for our children, and the likely relationship between the two. If children do not receive love and care from their parents, then the natural familial care cycle is broken, and they are less likely to wish to care for their parents once they reach old age. The rise in social care spending for children across the West demonstrates an increase in the most severe cases of parental neglect and family breakdown. As outlined above, local authorities in England spent £12.2 billion on social care for children in 2023. However, within this expenditure, the amount dedicated to early
interventions such as children’s centres, family hubs, and family support services has almost halved since 2011. Contrastingly, spending on late intervention services such as children entering the care system, youth justice, and child protection has increased by 57%—overwhelmingly driven by the surge in the number of children needing residential care placements, the cost of which is now higher than all early intervention services spending combined. The overall trend is a shocking one: the total number of children in the state care system is now 28% higher than it was in 2011.56 And the spending data shows that interventions which focus on keeping children with their parents are declining, and interventions in which children are taken out of the home and separated from their parents are rapidly rising. Nothing could portray the cost and severity of family breakdown more starkly.
The experience of family breakdown in all its forms—including the extreme cases above—has major ramifications for our mental health and wellbeing. The epidemic of mental health issues currently facing the West is therefore intrinsically linked with family breakdown. In the United States, mental health expenditure is now estimated at $282 billion annually, equivalent to 1.7% of annual American economic consumption, or the budget of a major federal department.57 About a quarter of this figure is paid directly out of the government’s Medicaid programme.58 In the United Kingdom, £12 billion, or 8% of the National Health Service’s total budget, was spent on mental health services in 2021-22, rising by 2.7% from 2017-18—and by 7% amongst children and young people.59 And in Australia, government spending on mental health services rose to $12.2 billion (AUD) in 2021–22, from $10.9 billion in 2017–18.60 And once again, service provision is already struggling to meet the growing demand across the board. There is only so far that the state will be able to cope with these rising costs, plus a shrinking tax base, and a less healthy workforce, before the model begins to crack. It seems there may be no substitute for addressing the root cause and renewing the health of our families.
Another major factor when considering the relationship between family formation and public budgets is the cost of family breakdown on welfare expenditure. Welfare spending in the United Kingdom makes up a substantial proportion of the country’s GDP and an enormous proportion of the public budget. In 2024-25, for example, total welfare spending is forecast to make up around 11% of GDP and 24.9% of total public
spending.61 Some of this welfare spending is directly related to the aging population and has been dealt with elsewhere,62 but some of it is due to increases in people who require welfare because of their limited workforce participation.
What is more, welfare expenditure is forecast to grow far faster than total public sector spending.
Consider the following chart put together using data from forecasts by the Office for Budget Responsibility (“OBR”). Here we see that Department of Work and Pensions (“DWP”) social security is increasing faster than overall public expenditure, meaning that it makes up a larger percentage of public expenditure over time. As already stated, this trend is directly tied to the aging population, associated with poor family formation and low fertility rates. But when compared with the explosion in forecast Universal Credit claims—the principal form of income-supplementation welfare in the United Kingdom— the growth in DWP social security looks modest by comparison. According to these forecasts, by 2029-30 overall public expenditure will have increased by around 24%, while Universal Credit spending will have increased by 80%.63
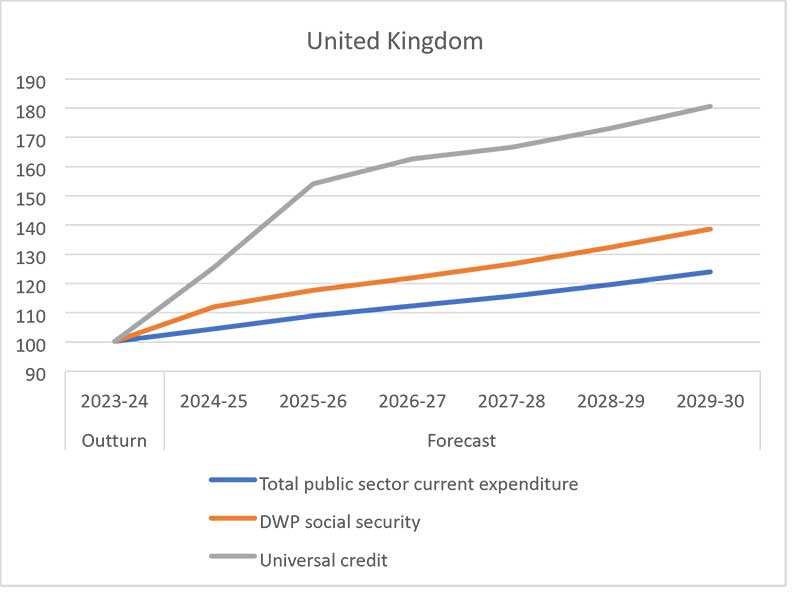
Unlike pension claims, we cannot attribute the increase in Universal Credit claims to the effects of an aging society. We can, however, attribute some of this increase to a breakdown in stable family structure—something that is intimately linked to the overall demographic problems that advanced Western economies are suffering from. Universal Credit claims encompass a wide variety of welfare payouts, from people who are temporarily unemployed, to people who are permanently unemployed due to disability. Temporary unemployment tends to be a cyclical phenomenon associated with rising and falling economic prospects. In a recession, when people are laid off, for example, the number of temporarily unemployed will rise as the number of available jobs falls.
The data shows clearly, however, that the number of people who are claiming Universal Credit without having to look for work is rising. In January 2019, for example, the number of people claiming Universal Credit while “searching for work” was around 700,000 people, while the number of people claiming Universal Credit while having “no work requirements” was around 350,000 people. By January 2024, the number of people claiming Universal Credit while “searching for work” had risen to 1.4 million. But the number of people claiming Universal Credit while having “no work requirements” rose to 2.3 million. Claimants who were “searching for work” roughly doubled, while claimants with “no work requirements” rose 6.6 times. This cannot be explained with reference to changes in the unemployment rate. In January 2019, the unemployment rate in Britain stood at 4%, while in January 2024 it also stood at 4%. Apart from during the pandemic, when there was a brief uptick in unemployment, there seemed to be plenty of job openings to accommodate people who wanted to work.65
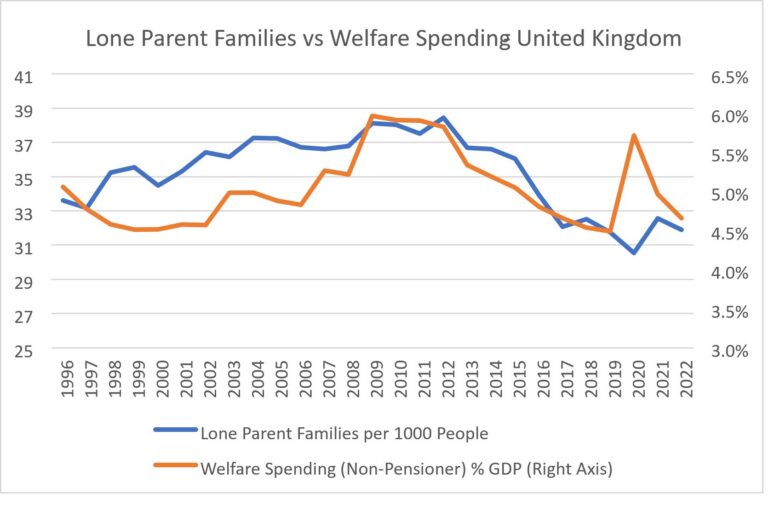
In this paper, we will not concern ourselves with all the factors that have contributed to this enormous rise in claimants for Universal Credit that have no work requirements. We merely note that this is a large problem weighing on the fiscal situation of the United Kingdom. Here we will focus on one component of welfare spending in the United Kingdom: the contribution that is made by the breakdown of stable families in Britain. The following chart shows the evolution of family types in the United Kingdom. A few trends stand out. Overall, families are falling as a percentage of the population. Yet at the same time as the overall share of families is falling, the number of lone parent families is rising. This increase was particularly acute between 1996—when the data started being collected—and 2012.66 After this, the number of lone parent families fell until 2020, and then started to rise again. Overall, the number of lone parent families as a share of the population is roughly the same in 2023 as it was in 1996. At the same time, however, the number of families as a share of the population overall has fallen by around 6.6%. Logically, this means that the overall share of lone parent families as a percent of total families has been rising over this period.
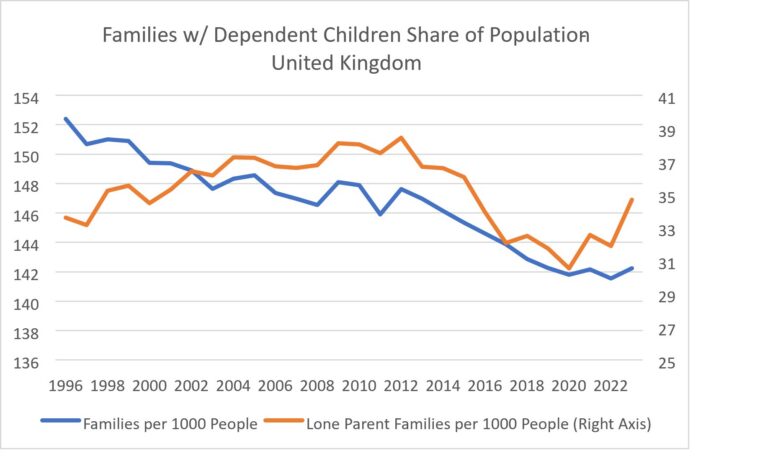
Next, let us look at the relationship between lone parent families as a share of the population, and non-pensioner welfare spending as a share of GDP. The following chart shows that they rise and fall together. Outside of the spike in welfare spending associated with COVID-19 and the lockdowns, the share of lone parent families in the population tracks the welfare spending share of GDP quite well. While correlation does not prove causation, this chart is very suggestive and implies that there is a strong relationship between the two variables.
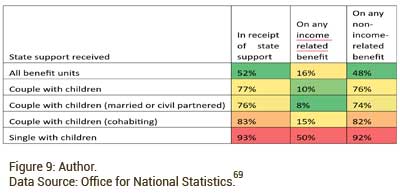
We can firm up this relationship by looking at the statistics on benefits by family type in Britain. The following table shows the percentage of any given family type that receives a variety of benefits. Here two broad points stand out. First, a very large percentage of single parent families receive benefits—over 90% in total. But a good portion of this amount is transfer payments to help families. Second, and more importantly from the perspective of our analysis, 50% of single parent families receive income-related benefits which can be read as welfare rather than transfer payments. This is 3.3 times higher than couples with children that are cohabiting and 6.3 times higher than married couples with children. Taken together with the data that shows a correlation between lone parent families as a share of the population and welfare spending as a percentage of GDP, we can now say with a very high degree of confidence that single parent families are having a huge impact on welfare spending.
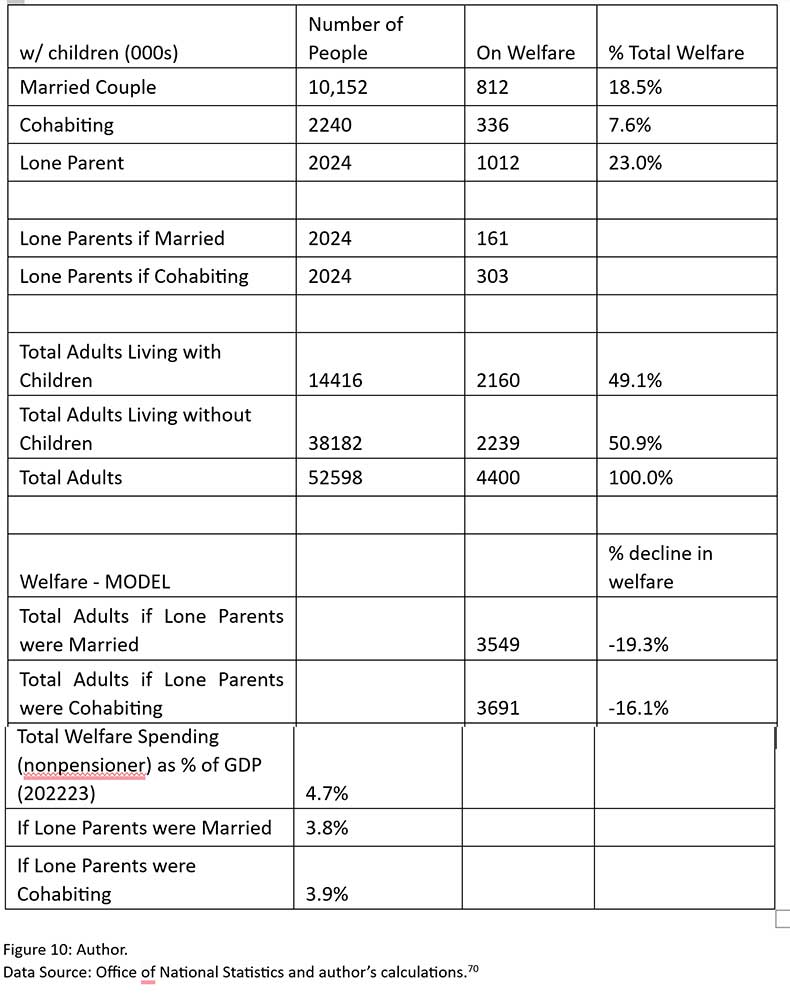
These statistics will allow us to model their impact, and estimate the number of people on welfare in Britain by family type. From here we can estimate what overall welfare spending would look like if single parent families were married or cohabiting. The results of this model are provided in the table below, and they suggest that if parents that are currently single were instead cohabiting, welfare spending as a percentage of GDP would fall by around 16.1%. If these same parents were instead married, welfare spending as a percentage of GDP would fall by around 19.3%. Since non-pensioner welfare spending is currently around 4.7% of GDP, this would mean a decline in spending of 0.9% of GDP if lone parents were married and 0.8% if lone parents were cohabiting.
These reductions would represent a very significant decline in public expenditure even in the short-term. We have already seen that in the long term, welfare spending is projected to increase substantially. So, this initial decline would mean an even larger decline in public spending over the long-term. We have already seen that Universal Credit spending is projected to increase by 80% between now and 2029-2030, while overall public expenditure is expected to rise by only 24%. This projection means that,
if lone parents were married or cohabiting, we might see a reduction in public expenditure of around 1.2% of GDP over the long-term.
Another area where we can discern the costs of family breakdown is by considering crime.
Knowledge of the link between family formation and juvenile crime is as old as empirical sociology and criminology. Pioneering British criminologist and prison chaplain Reverend William Douglas Morrison wrote, in his 1915 book Juvenile Offenders, that “among the social circumstances which have had a hand in determining the future of the individual, it is enough for our present purpose that the family is chief.”71 With the rise of econometric and other statistical techniques in the latter half of the 20th century, researchers went on to prove this. In their extensive 1986 book, criminologists Ludwig Geismer and Katherine Wood summarised the postwar empirical literature saying that “family functioning variables as a group seem to be inextricably linked to delinquent behaviour. Juvenile delinquency appears to occur disproportionately among children in ‘unhappy homes.’”72 More recent studies have succeeded in quantifying these effects more accurately and have broadened out the links between family formation and crime. Meta studies—studies that survey multiple studies—have confirmed the initial findings.73
Looking at simple surveys of the family backgrounds of prison inmates clearly shows the link between family formation and adult crime. A recent study by the British government found that 24% of adult prisoners stated that they had been in care at some point in their childhood. For reference, in 2022 there were a record 82,170 children in care in England out of a population of 12.7 million. That means that while in any given year only around 0.64% of children will be in care, 24% of prisoners will have been in care.74
Some of the recent literature on how family formation impacts the propensity to commit crime is even more interesting from the perspective of family policy. There is substantial evidence that having a child reduces criminality for the child’s parents: for mothers this starts during pregnancy with drug, alcohol, and economic-related arrests falling precipitously. Arrests increase shortly after birth but remain at only 50% of their former levels. The impact is not quite as large for fathers but is still significant, with arrests for fathers falling by about 20% for property, drug, and driving under the influence. Marriage seems to be a strong predictor for low crime rates too, including domestic violence.75
Crime has impact on both economic growth and government budgets. Recent estimates indicate that in 2017, crime cost the American economy approximately $2.6 trillion.
Simple monetary expenditures caused by criminal offending cost the economy around 3% of GDP, or roughly equivalent to what is spent on national defence, while 2.5% of total spending on healthcare was due to criminal victimisation.76 These are shocking numbers and much underappreciated by both policymakers and the public.
Crime also costs the taxpayer money. The following chart shows the relationship between the homicide rate in the United Kingdom and public safety expenditure as a percentage of GDP. We see that there is a very clear correlation. Public spending on public safety tends to rise and fall with the homicide rate. This is unsurprising. When homicide rates rise, policymakers get concerned about public safety and channel more public expenditure into the sector. When they fall, and voters are less concerned about crime, and these expenditures tend to fall.
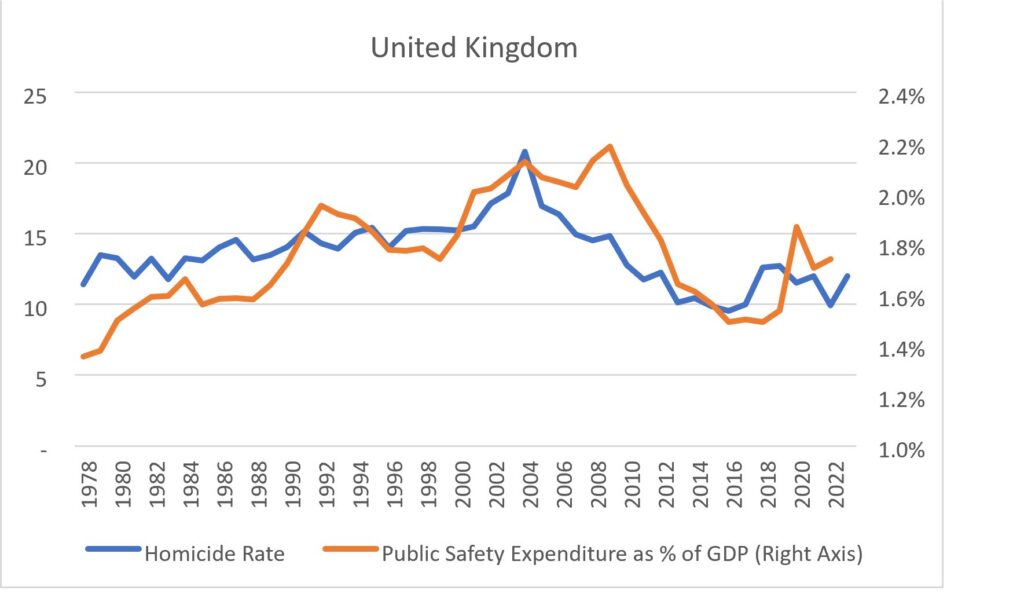
Knowing this relationship allows us to calculate roughly how much money might be saved if crime were at a lower level. Here, however, we must be careful to establish a solid base case. We only have public safety expenditure data since 1978 which is why this is the starting date in the above chart. We have data for the British homicide rate going back to 1898, however. If we assume that the relationship between the homicide rate and public safety expenditure holds looking backwards, this allows us to model the rate of public safety expenditure. This is shown in the following chart. This chart is important because it should provide the baseline scenario of what we assume to be a “normal” amount of crime. As previously discussed, family breakdown in Britain had already begun to take place by 1978, so using data from this year to establish our base case is misguided. This longer-term data shows that the homicide rate was extremely stable between 1898 and the late-1960s—the very time when no-fault divorce was legalised and the divorce rate started to climb dramatically. We also see that the homicide rate before the late-1960s was substantially lower than it is today. We would argue that it is this pre-no fault divorce homicide rate that we should take as our baseline scenario when considering the impact of family formation on public safety expenditure.
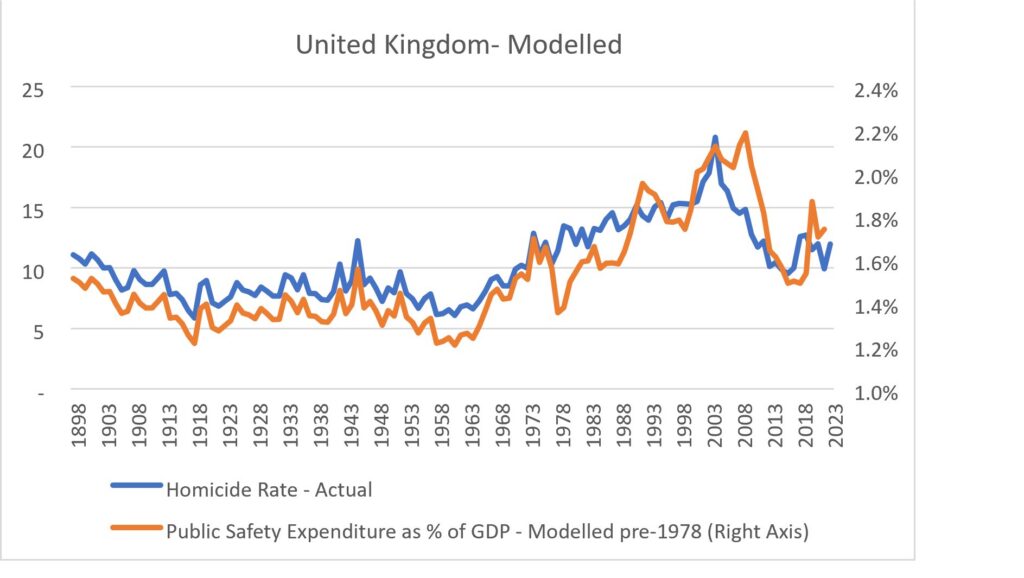
This baseline allows us to estimate what public safety expenditure might be if Britain had more stable family formation. Between 1898 and 1970, our model shows that average public safety expenditure as a percentage of GDP was around 1.35%. Between 1970 and today, however, the average was around 1.7%. This increase implies that if homicide rates came down to pre-1970 levels, because Britain was producing more stable family structures, public safety expenditure might fall by around 0.35% of GDP.
The data on crime shows clearly why governments should pursue “family policy” rather than simply “pro-natal policy”. Firstly, it is unlikely that pro-natal policy will work without family policy because the trends that are causing low fertility rates have been
in motion for many years and have become deeply rooted in our culture. But beyond this obstacle, the benefits for society of maintaining intact families is enormous. When looking at the extensive literature on the effects of family breakdown—effects which we did not understand half a century ago when these trends started, but we do today—many of the “hot button” issues in politics can be traced back to family breakdown. In a society that was more pro-family—that promoted family in its media and supported it through fiscal policy—there is good reason to think that these problems would not be nearly as bad.
Family policy should be conceptualised as impacting much more than simply the fertility rate. While it is no doubt true that developed Western countries are facing a demographic meltdown and that this will put severe strains on their economies and on their welfare and pension systems, the benefits of family policy go far beyond staving off demographic catastrophe. Targeting the fertility rate by gearing the government benefit system to aggressively encourage family formation and childbirth could prove to be a reliable way to maintain economic growth. For years economists and policymakers have focused obsessively on productivity growth. But they have only done so due to the ideological blinders that have adopted from taking mainstream macroeconomics courses, which impose very limited conceptions of what makes economies grow. The reality is that policymakers have little to no control over productivity growth—indeed, it is not even clear what productivity growth is. Yet there are good reasons to believe that they could try to gain control over the fertility rate.
Yet the benefits of family policy do not stop here. Money spent on family policy can also, via its encouragement of higher marriage rates and lower divorce rates, have a major impact on crime. It can also, through this same mechanism, bring down rates of mental illness and drug abuse. Nor are these simple “qualitative” changes that improve quality of life, although they undoubtedly do. As we have seen, more and more people are dropping out of the shrinking labour force and two of the largest causes of this are mental health issues and drug abuse. Rising crime is costing a fortune and sucking up
economic resources. The deeper we dig the more we see that a great many of the economic problems we currently face can be traced back to poor family formation.
It should be obvious at this point why this paper has been preoccupied with “family policy” in the first place, rather than, say, a “natalist policy”—because the goal of such a policy is to form families. Of course, the long-term goal of a family policy is to raise the birth rate, but this should not be seen as the exclusive goal. Since the debate on family policy has broadened and deepened there has been a distressing tendency of commentators and policymakers overly focusing on short-term metrics. They will point to countries such as Hungary—a country that is now at the centre of the family policy debate due to it being a leader in experimenting with pro-family policies—and chastise them for not raising their birth rates.79 This displays an overly technocratic conception of family formation and childrearing, as if birth rates are a variable that can be “controlled” by the government much in the same way that the central bank controls the interest rate. This is obviously wrong-headed. The decline in fertility we are seeing across the world is due to deep-rooted cultural changes that have taken place over the course of a century or more. These changes have resulted in people setting their priority to form a family much lower than is economically or socially sustainable. Reversing these cultural changes or channelling them in a more sustainable direction is a far more complex task than a central bank raising or lowering interest rates.
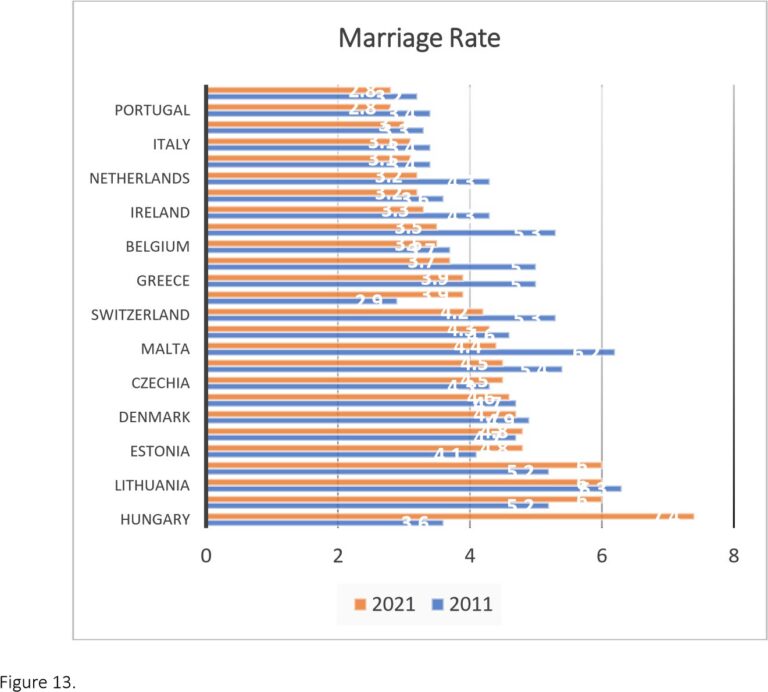
This is why we focus on “family” rather than simply on “natalism”. The short-term goal of a family policy is—to put it simply—to incentivise family formation. As this normalisation takes place, we expect that an increase in the number of children will follow logically—although it may not follow immediately. Looked at from this holistic rather than crudely technocratic perspective, the Hungarian family policy is bearing fruit. Between 2010 and 2021, as the Hungarian government instituted their family policy, the TFR increased 27%. But it has been called into question by some who highlight that there has been a recovery of birth rates across the region in this period due to an economic recovery that has taken place after the effects of the Global Financial Crisis of 2008.80 This criticism has been followed up by pointing to the falling birth rate in Hungary due to the negative economic consequences of the war in Ukraine.81 Once again, we believe that focusing on these short-term statistics is based on a misguided conception of how a family policy should work. Rather than watching for short-term moves in the Hungarian fertility rate, we would be far better off looking at the rate of family formation and stability in the country in the wake of the family policy measures implemented there. Between 2010 and 2021, the marriage rate in Hungary rose 102% while the divorce rate fell 24%. Hungary now has gone from having one of the lowest marriage rates in Europe in 2011 (3.6) to the highest in 2021 (7.4). No one disputes that these enormous changes to the marriage statistics in Hungary are due to the government’s family policies.
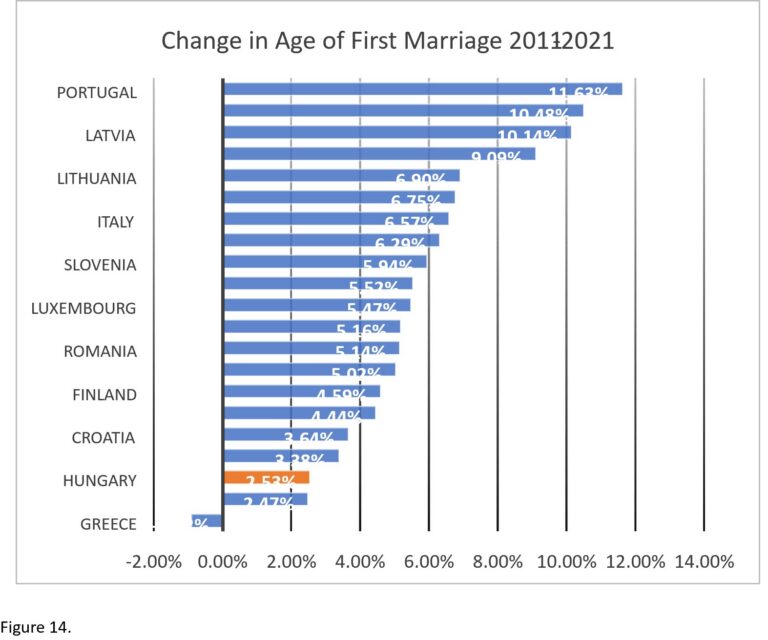
We might also look at the age of first marriage. This should have a big impact on family formation, as early marriage encourages early childbearing which in terms predicts larger families.84 When we look at the data, we see that the age of first marriage has risen in Hungary between 2011 and 2021, but it is one of the smallest increases in Europe—beaten by Greece and almost identical to Switzerland. A regional comparison is instructive here: in nearby countries of similar levels of economic development like Romania, Poland, Czechia, and Slovenia the age of first marriage has increased on average by 5.63% in this time period, but for Hungary it has increased only 2.53%. Obviously, Hungary should be trying to reduce the age of first marriage, but the fact that the increase is one of the smallest in Europe and is less than half that of its peers in the region shows that the family policy is likely having a large impact. This is especially so if we consider that prior to the family policies being enacted in Hungary, the age of first marriage was rising rapidly in the country roughly in line with its peers in the region.85
We believe that other commentators and researchers have missed just how profound a cultural change these statistics, especially the increase in the marriage rate, represent: roughly twice as many Hungarians are getting married after the implementation of family policies as were before the implementation. This represents an enormous cultural shift within the country. Cultural trends spread through social mimesis. That is, people change their behaviour in line with their social peers.88 For example, in the nineteenth century and even in the first half of the twentieth century, it was seen as “normal” to settle down and have a family—usually quite early in adulthood. A person living in this society would not so much get married and have a family out of social pressure as they would simply because it was what everyone else did. Viewed from this perspective, the achievement of the Hungarian family policy is remarkable. What the statistics suggest is that it is becoming increasingly “normal” for young people to get married rather than simply cohabit.
This is a far more fruitful approach to family policy: rather than obsess over short-term moves in birth rates that are highly influenced by economic events, focus on the cultural and social changes in a country that will lead to a long-term revitalisation of family life in the future. The Hungarian Prime Minister himself has stated that the goal is to get birth rates back to replacement level (2.1) by 2035 which seems like a far more tractable goal than trying to hit a birth rate target in the next year.
This paper has sought to provide a comprehensive view of the implications for prosperity of good social policy and family policy.
The family touches everything, from birth rates through to the basics of social flourishing. In turn, each of these areas has profound ramifications for the health of our economies and the burden of government spending.
This paper has shown that we must reframe how we think about economic growth. There is more to long-run economic growth than productivity, yet few economists take the time to think about the factors that drive the growth of the productively employed population. Two key components of this are labour force participation and population
growth. We have argued here that restoring the family is critical if we are to see an uptick in our demographic trends and a reversal of the downward trajectory in labour force participation. We identified that the factors which are influencing these trends— be they low fertility rates, mental health issues, drug abuse, or criminality—are all deeply tied to family breakdown.
Similarly, our burgeoning government budgets are symptomatic of a frayed social fabric. Someone has to shoulder the burden of care a society needs: it will be the state or the family. Rising mental health costs are a function of family breakdown, and the same story runs through crime, substance addiction, and welfare.
Many of the points in this paper could be followed up with entire studies of their own. Our hope is that this will provide a window into a fresh form of analysis, one that does not neglect the significance of the family but recognises that it touches every aspect of life.
Family policy may not be the single silver bullet needed to solve all our social and economic problems. But as policies go, it is the closest to a single bullet that we have.
1 “General government debt”, OECD, Accessed 3rd December 2024, https://www.oecd.org/en/data/indicators/general-government-debt.html.
2 “Spending on aged care”, GEN Aged Care Data: Australian Institute of Health and Welfare, last updated 30 April 2024 (accessed 6 December 2024), https://www.gen-agedcaredata.gov.au/topics/spending-on-agedcare#:~:text=Government%20spending%20on%20aged%20care%20services%20per%20person%20in%20th e,support%20(%242%2C040%20per%20person).
3 Daisy Elliott, “Why we need to turn the tide of children’s social care spending”, Action for Children, 3 September 2024, https://www.actionforchildren.org.uk/blog/why-we-need-to-turn-the-tide-of-childrenssocial-carespending/#:~:text=Local%20authorities%20in%20England%20spent,decline%20and%20then%20steady%20 growth.
4 “Universal Credit statistics, 29 April 2013 to 11 January 2024” Department for Work & Pensions, updated 23 October 2024 https://www.gov.uk/government/statistics/universal-credit-statistics-29-april-2013-to-11january-2024/universal-credit-statistics-29-april-2013-to-11-january-2024.
5 Kim Williams et al., “Prisoners’ Childhood and Family Backgrounds”, Ministry of Justice, Research Series 4/12, 2012, https://assets.publishing.service.gov.uk/media/5a7c543de5274a1b00423088/prisonerschildhood-family-backgrounds.pdf.
6 B. A. Shaw et al., “Emotional Support from Parents Early in Life, Aging, and Health”, Psychology and Aging, (2004) 19 (1): 4–12. https://doi.org/10.1037/0882-7974.19.1.4.
7 A. Mooney, C. Oliver, and M. Smith, “Impact of Family Breakdown on Children’s Well-Being Evidence Review”, Institute of Education, University of London: Thomas Coram Research Unit, 2009, p.7, https://dera.ioe.ac.uk/11165/1/DCSF-RR113.pdf.
8 I. Kolvin et al., “Social and Parenting Factors Affecting Criminal-Offence Rates”, British Journal of Psychiatry, (1988) 152 (1): pp. 80–90..
9 J. Pryor, and B. Rodgers, “Children in Changing Families”, cited in A. Mooney, C. Oliver, and M. Smith, “Impact of Family Breakdown on Children’s Well-Being: Evidence Review”, London: Department for Children, Schools and Families, 2009.
10 Lyman Stone and Erin Wingerter, “Is There Hope for Low Fertility? “Demographic Rearmament” in
Southern Europe”, Institute for Family Studies, May 2024, https://ifstudies.org/ifsadmin/resources/reports/ifs-southerneuropereport-final-1.pdf, pp. 21-22
11 Eleanor Krause and Isabel V. Sawhil, “What We Know and Don’t Know About Declining Labor Force
Participation: A Review” Brookings Institute Center on Children and Families, 17 May 2017, https://www.brookings.edu/articles/what-we-know-and-dont-know-about-declining-labor-forceparticipation-a-review/.
12 World Bank. Labour Force Participation Rate. https://data.worldbank.org/indicator/SL.TLF.CACT.MA.ZS
13 Jonathan Rothwell, “Scarred Boys, Idle Men: Family Adversity, Poor Health, and Male Labor Force Participation”, Institute for Family Studies, https://ifstudies.org/blog/scarred-boys-idle-men-family-adversitypoor-health-and-male-labor-force-participation.
14 E.M. Merz, N. S. Consedine, H. J. Schulze,, and C. Schuengel, “Well-being of adult children and ageing parents: Associations with intergenerational support and relationship quality.” Ageing and Society, 29, (2009), pp. 783–802. doi:10.1017/s0144686x09008514.
15 M. R. Gunnar et al., “Stress reactivity and attachment security”, Developmental Psychobiology, (1996) 29 (3): pp. 191–204.
16 R. G. Maunder and J. J. Hunter, “Attachment and psychosomatic medicine: Developmental contributions to stress and disease”, Psychosomatic Medicine, (2001) 63 (4): pp. 556 –567. doi:10.1097/00006842200107000-00006.
17 Thomas, P.A., Liu, H., & Umberson, D. (2017). “Family Relationships and Well-Being.” Innovation in Aging, 1 (3): 1–11. https://doi.org/10.1093/geroni/igx025.
18 Carr, D., & Springer, K.W. (2010) “Advances in Families and Health Research in the 21st Century.” Journal of Marriage and Family 72 (3): 743–61. https://doi.org/10.1111/j.1741-3737.2010.00728.x.
19 D. Umberson, K. Williams, and M. B. Thomeer, “Family status and mental health: Recent advances and future directions.”, In C. S. Aneshensel and J. C. Phelan (Eds.), Handbook of the sociology of mental health, 2013 (2nd edition, Dordrecht: Springer Publishing), pp. 405–431.
20 D. A. Sbarra, “Marriage protects men from clinically meaningful elevations in C-reactive protein: Results from the National Social Life, Health, and Aging Project (NSHAP)”. Psychosomatic Medicine, (2009) 71 (8): p.
828.
21 Sigmund Freud, Three Essays on the Theory of Sexuality and Other Works. (1905: Penguin Books). 22 F. Perales, et al., “Family Structure and Childhood Mental Disorders: New Findings from Australia”, Social Psychiatry and Psychiatric Epidemiology. (2017) 52 (3), pp. 423-433.
23 P. Frijterset al., “Mental Health and Labour Market Participation: Evidence from IV Panel Data Models”. Institute of Labor Economics, 2010, https://www.iza.org/publications/dp/4883/mental-health-and-labourmarket-participation-evidence-from-iv-panel-data-models.
24 Y. Luo et al., “National Prescription Patterns of Antidepressants in the Treatment of Adults With Major Depression in the United States Between 1996 and 2015: A Population Representative Survey Based Analysis”, Frontiers in Psychiatry, 2020, Vol. 11.
25 M. L. Bryan, et al., “Mental Health and Employment: A Bounding Approach Using Panel Data”, Oxford Bulletin of Economics and Statistics, 2020, Vol 84, No 5.
26 W. D. Crano and V. Hemovich, “Family Structure and Adolescent Drug Use: An Exploration of Single-Parent Families”, Substance Use and Misuse. (2009) 44 (14), pp. 2099-113.
27 S. H. Aggenet al., “Role of Parental Divorce and Discord in the Intergenerational Transmission of Alcohol Use Disorder”, Drug and Alcohol Dependence. (2022) Vol 234.
28 M. T. Frenchet al., “Illicit Drug Use, Employment, and Labor Force Participation”, Southern Economic Journal. (2001) Vol 68, No 2, pp. 349-368.
29 Merianne Rose Spencer, M.P.H., Arialdi M. Miniño, M.P.H., and Margaret Warner, Ph.D., “Drug Overdose Deaths in the United States, 2001–2021”, National Center for Health Statistics, NCHS Data Brief, No. 457,
December 2022, https://www.cdc.gov/nchs/data/databriefs/db457.pdf
30 Merianne Rose Spencer, M.P.H., Sally C. Curtin, M.A., and Matthew F. Garnett, M.P.H., “Alcohol-induced
Death Rates in the United States, 2019–2020”, National Center for Health Statistics, NCHS Data Brief No. 448, November 2022,
https://www.cdc.gov/nchs/products/databriefs/db448.htm#:~:text=Vital%20Statistics%20System-
,Rates%20of%20alcohol%2Dinduced%20deaths%20generally%20increased%20from%202000%20to,in%202 020%20(Figure%201).
31 Anne Case and Angus Deaton, Deaths of Despair and the Future of Capitalism, Princeton University Press, 2020.
32 “Middle-aged Generation Most Likely to Die by Suicide and Drug Poisoning”, Office of National Statistics,
13 August 2019, https://www.ons.gov.uk/peoplepopulationandcommunity/healthandsocialcare/healthandwellbeing/articles/ middleagedgenerationmostlikelytodiebysuicideanddrugpoisoning/2019-08-13.
33 “Births, Deaths, and Marriages”, Office for National Statistics, 2021, https://www.ons.gov.uk/peoplepopulationandcommunity/birthsdeathsandmarriages/divorce.
34 Note that the chart uses weighed growth rates of each of the variables. “Population growth” refers to growth in the working age population.
35 Data taken from a wide range of datasets from the Office of National Statistics, https://www.ons.gov.uk/. 36 Data taken from a wide range of datasets from the Office of National Statistics, https://www.ons.gov.uk/.
37 Paul Morland and Philip Pilkington, “Migration, Stagnation, or Procreation: Quantifying the Demographic Trilemma” ,Alliance for Responsible Citizenship, 2023, https://www.arcforum.com/social-fabric/thedemographic-trilemma-.
38 Note that in the table, as well as in all the discussions that follow, we are referring to inflation-adjusted or real GDP growth..
39 The mathematical identity used to derive these numbers is laid out in the table. Note that all the components of employment growth (population growth, participation rate, and unemployment rate) are weighted growth numbers.
40 Data taken from a wide range of datasets from the Federal Reserve of Economic Data, https://fred.stlouisfed.org/.
41 Data taken from a wide range of datasets from the Office of National Statistics, https://www.ons.gov.uk/. 42 “Fertility rate, total (births per woman) – Japan”, World Bank Group, accessed 17 December 2024, https://data.worldbank.org/indicator/SP.DYN.TFRT.IN?locations=JP.
43 “Total Factor Productivity at Constant National Prices for Japan”, FRED, accessed 17 December 2024, https://fred.stlouisfed.org/series/RTFPNAJPA632NRUG.
44 See for example: Matteo Lanzafame and Antionio Francesco Gravina, “Robots To the Rescue: Three Ways Automation Can Cushion the Impact of Aging on Economic Growth”, Asian Development Blog, 2023, https://blogs.adb.org/blog/robots-rescue-three-ways-automation-can-cushion-impact-aging-economicgrowth.
45 Louise Perry, Fiona Mackenzie, and Ellen Pasternack, “Who Cares? The Real Cost of Childcare”, Alliance For Responsible Citizenship, 2023, https://www.arcforum.com/social-fabric/the-real-cost-of-childcare-.
46 “Healthcare expenditure, UK Health Accounts: 2022 and 2023”, ONS, 31 May 2024, https://www.ons.gov.uk/peoplepopulationandcommunity/healthandsocialcare/healthcaresystem/bulletins/ ukhealthaccounts/2022and2023.
47 “Social care 360: expenditure”, The King’s Fund, 13 March 2024, https://www.kingsfund.org.uk/insightand-analysis/long-reads/social-care-360expenditure#:~:text=What%20was%20the%20annual%20change,increased%201.1%25%20in%20real%20ter ms.
48 Daisy Elliott, “Why we need to turn the tide of children’s social care spending”, Action for Children, 3 September 2024, https://www.actionforchildren.org.uk/blog/why-we-need-to-turn-the-tide-of-childrenssocial-carespending/#:~:text=Local%20authorities%20in%20England%20spent,decline%20and%20then%20steady%20 growth.
49 “Health expenditure by sources of funding”, DEUSTATIS Statistisches Bundesamt, 25 April 2024, https://www.destatis.de/EN/Themes/Society-Environment/Health/Health-Expenditure/Tables/sources-offunding.html#fussnote-1-50886.
50 “NHE Fact Sheet”, CMS.gov, last modified 9 October 2024 (accessed 6 December 2024),
https://www.cms.gov/data-research/statistics-trends-and-reports/national-health-expenditure-data/nhefact-sheet.
51 “Spending on aged care”, GEN Aged Care Data: Australian Institute of Health and Welfare, last updated 30 April 2024 (accessed 6 December 2024), https://www.gen-agedcaredata.gov.au/topics/spending-on-agedcare#:~:text=Government%20spending%20on%20aged%20care%20services%20per%20person%20in%20th e,support%20(%242%2C040%20per%20person).
52 “Social care 360: expenditure”, The King’s Fund, 13 March 2024, https://www.kingsfund.org.uk/insightand-analysis/long-reads/social-care-360expenditure#:~:text=What%20was%20the%20annual%20change,increased%201.1%25%20in%20real%20ter ms.
53 Antonella Bancalari and Ben Zaranko, “IFS Green Budget 2024: Adult social care in England: what next?”, Institute for Fiscal Studies, 10 October 2024, https://ifs.org.uk/publications/adult-social-care-england-whatnext#:~:text=Public%20spending%20on%20adult%20social%20care%20for%20the%20average%2060,as%20 high%20(%C2%A3941).
54 George Stevenson, Nuha Bazeer, Hiba Sameen, and Lucinda Allen “Social care funding: Three key questions about funding in England”, The Health Foundation, 4 September 2024, https://www.health.org.uk/publications/long-reads/social-care-funding.
55 David Foster and Rachael Harker, “Funding for adult social care in England”, House of Commons Library, 21 February 2024, https://commonslibrary.parliament.uk/research-briefings/cbp-7903/.
56 Daisy Elliott, “Why we need to turn the tide of children’s social care spending”, Action for Children, 3 September 2024, https://www.actionforchildren.org.uk/blog/why-we-need-to-turn-the-tide-of-childrenssocial-carespending/#:~:text=Local%20authorities%20in%20England%20spent,decline%20and%20then%20steady%20 growth.
57 Jonathan Sperling, “Mental Health Is Costing the US Economy Billions — Increasing Access Could Be the Solution”, Columbia Business School, 28 May 2024, https://business.columbia.edu/insights/businesssociety/mental-health-costing-us-economy-billions-increasing-access-could-be.
58 “Reducing the Economic Burden of Unmet Mental Health Needs”, The White House, 31 May 2022, https://www.whitehouse.gov/cea/written-materials/2022/05/31/reducing-the-economic-burden-of-unmetmental-healthneeds/#:~:text=The%20Federal%20Government%20covers%20some,But%20more%20could%20be%20done
59 “Mental health 360: funding and costs”, The King’s Fund, 21 February 2024, https://www.kingsfund.org.uk/insight-and-analysis/long-reads/mental-health-360-funding-costs.
60 “Expenditure on mental health services”, Australian Institute of Health and Welfare, last updated in April
2024 (accessed 6 December 2024), https://www.aihw.gov.au/mental-health/topicareas/expenditure#exp_mhs/.
61 “Benefit Expenditure and Caseload Tables 2024”, Department of Work and Pensions, 2024, https://www.gov.uk/government/publications/benefit-expenditure-and-caseload-tables-2024; https://www.gov.uk/government/collections/benefit-expenditure-tables.
62 Matthew Tinsley, “Too Much to Lose: Understanding and Supporting Britain’s Older Workers”, Policy Exchange, 20 June 2012, https://policyexchange.org.uk/publication/too-much-to-lose-understanding-andsupporting-britains-older-workers.
63 “Economic and fiscal outlook – October 2024”, Office for Budget Responsibility, 30 October 2024, https://obr.uk/efo/economic-and-fiscal-outlook-october-2024/.
64 Office for Budget Responsibility, last accessed 6 January 2025, https://obr.uk/.
65 “Universal Credit statistics, 29 April 2013 to 11 January 2024” Department for Work & Pensions, updated 23 October 2024 https://www.gov.uk/government/statistics/universal-credit-statistics-29-april-2013-to-11january-2024/universal-credit-statistics-29-april-2013-to-11-january-2024.
66 It is unfortunate that we do not have data going back to the early-1960s. The divorce statistics suggest that the main increase in lone parent families was likely in the 1970s after no-fault divorce was legalised in the late-1960s. If we had access to data on family type going back as far as this, we could probably get a much better sense of how much contemporary British welfare spending is dominated by the breakdown in stable families. Since we do not have access to this data, however, we will have to rely on the data from 1996 onwards, twenty years after these developments had taken place. For this reason, our estimates on how much the rise of lone parent families has impacted the British government budget should be taken as a very conservative estimate.
67 “Families and households in the UK: 2023”, Office for National Statistics, 8 May 2024, https://www.ons.gov.uk/peoplepopulationandcommunity/birthsdeathsandmarriages/families/bulletins/fami liesandhouseholds/2023.
68 Office for National Statistics, accessed 6 January 2025, https://www.ons.gov.uk/. 69 Office for National Statistics, accessed 6 January 2025, https://www.ons.gov.uk/.
70 Office for National Statistics, accessed 6 January 2025, https://www.ons.gov.uk/.
71 W. D. Morrison, Juvenile Offenders, 1915: Ulan Press.
72 L. Geismerand K. Wood, Family and Delinquency – Resocializing the Young Offender, 1986: Human Sciences Pr.
73 J. H. Rankin and L. E. Wells, “Families and Delinquency: A Meta-Analysis of Broken Homes”, Social Problems, (1991) 38 (1), pp. 71-93.
74 Kim Williams et al., “Prisoners’ Childhood and Family Backgrounds”, Ministry of Justice, Research Series 4/12, 2012, https://assets.publishing.service.gov.uk/media/5a7c543de5274a1b00423088/prisonerschildhood-family-backgrounds.pdf.
75 M. N. Massenkoff and E. Rose, “Family Formation and Crime”, The Becker Frieman Institute for Economics at the University of Chicago, Research Brief, September 2022, https://bfi.uchicago.edu/workingpaper/family-formation-and-crime/. ; C. Bijleveld et al., “Criminality and Family Formation: Effects of Marriage and Parenthood on Criminal Behaviour for Men and Women”, Crime and Delinquency, (2014) 60(8), pp. 1209–1234.
76 M. A. Cohanet al, “Incidence and Costs of Personal and Property Crimes in the United StatesA, 2017”, Journal of Cost-Benefit Analysis, (2021) Vol 12, No 1.
77 Office for National Statistics, accessed 6 January 2025, https://www.ons.gov.uk/.
78 Office for National Statistics, accessed 6 January 2025, https://www.ons.gov.uk/.
79 M. Dunai and V. Romei, “Why Hungary’s Lavish Family Subsidies Failed to Spur a Baby Boom”, The Financial Times, 19 August 2024, https://www.ft.com/content/3ea257fd-e8ef-4f05-9b89-c9a03ea72af5. 80 L. Stone, “It’s Time for Social Conservatives to Stop Fawning Over Hungary”, American Enterprise Institute, https://www.aei.org/articles/its-time-for-social-conservatives-to-stop-fawning-over-hungary/.
81 R. Hogg, “Hungary Offered €30,000 to Couples Having 3 Kids—but its Birth Rate has Still Fallen to a Record Monthly Low”, Fortune, 19 August 2024, https://fortune.com/europe/2024/08/19/hungary-offered-e30000to-couples-having-3-kids-but-its-birth-rate-has-still-fallen-to-a-record-monthly-low/.
82 “Marriage and divorce statistics”, Eurostat, last updated March 2024, https://ec.europa.eu/eurostat/statisticsexplained/index.php?title=Marriage_and_divorce_statistics#Fewer_marriages.2C_fewer_divorces. 83 “OECD Family Database”, OECD, accessed 6 January 2024, https://www.oecd.org/en/data/datasets/oecdfamily-database.html.
84 M. A. Islam and A. Rahman, “Age at First Marriage and Fertility in Developed Countries: A Meta Analytical Review of 15 Demographic and Health Surveys”, Clinical Epidemiology and Global Health.
(2020) Volume 8, Issue 3, September 2020, pp. 775-779.
85 L. Derose, “Promising Trends in Marriage-Friendly Hungary” Mercator, 27 June 2023, https://www.mercatornet.com/promising_trends_in_marriage_friendly_hungary. 86 “Mean age at first marriage by sex”, Eurostat, last updated
11 November 2024, https://ec.europa.eu/eurostat/databrowser/view/tps00014/default/table?lang=en.
87 “OECD Family Database”, OECD, accessed 6 January 2024, https://www.oecd.org/en/data/datasets/oecdfamily-database.html.
88 S. R. Garrels, Mimesis and Science: Empirical Research on Imitation and the Mimetic Theory of Culture and Religion, 2021: Michigan State University Press.